

Mastering the Hammer Candle Pattern in Forex Trading
In the world of forex trading, candlestick patterns are powerful tools that help traders identify potential market reversals and continuations. Among these, the Hammer Candle Pattern stands out as a key indicator of a potential bullish reversal, often signaling the end of a downtrend and the beginning of a price recovery.
In this blog post, we’ll dive deep into what the Hammer Candle Pattern is, how to spot it on forex trading charts, and how traders can use it effectively in their trading strategies.

This free indicator will mark the Shooting Star and Hammer candle patterns on your chart when either of these setups are formed.
What is the Hammer Candle Pattern?
The Hammer Candle Pattern is a single-candlestick formation that signals a potential reversal from a bearish trend to a bullish one. It typically forms at the bottom of a downtrend and is characterized by its distinctive shape.
Key Features of the Hammer Candle:
- Small Real Body: The body of the candle is located at the upper end of the trading range, indicating a close near or above the opening price.
- Long Lower Shadow: The lower shadow is at least twice the size of the real body, reflecting a strong rejection of lower prices.
- Minimal Upper Shadow: There is little to no upper shadow, indicating that sellers were unable to push the price lower by the end of the session.
Understanding the Psychology Behind the Pattern
The Hammer Candle Pattern represents a tug-of-war between buyers and sellers:
- Early Session: Sellers dominate, pushing prices significantly lower.
- Later Session: Buyers step in with strong demand, driving prices back up to close near the opening price or higher.
This battle creates the hammer-like shape of the candle and signals that buyers have gained control, potentially reversing the downtrend.
How to Identify the Hammer Candle Pattern in Forex Trading
To effectively spot the Hammer Candle Pattern:
- Focus on Downtrends: The pattern is most effective when it appears after a sustained bearish trend.
- Examine Candle Proportions: Ensure the lower shadow is at least twice the size of the real body.
- Consider Market Context: Look for the pattern at or near significant support levels, which adds strength to the reversal signal.
Trading the Hammer Candle Pattern
When trading the Hammer Candle Pattern, it’s important to confirm the signal and apply sound risk management. Here’s a step-by-step approach:
1. Confirm the Reversal
- Wait for the next candle to close above the Hammer’s high, validating the bullish reversal.
- Use technical indicators like RSI or Stochastic Oscillator to confirm oversold conditions, which support the reversal thesis.
2. Set Your Entry Point
- Enter a long position above the high of the Hammer Candle.
3. Place Stop-Loss Orders
- Position your stop-loss just below the low of the Hammer Candle to protect against false signals.
4. Define Your Take-Profit Levels
- Identify key resistance levels or use Fibonacci retracement levels to set realistic profit targets.
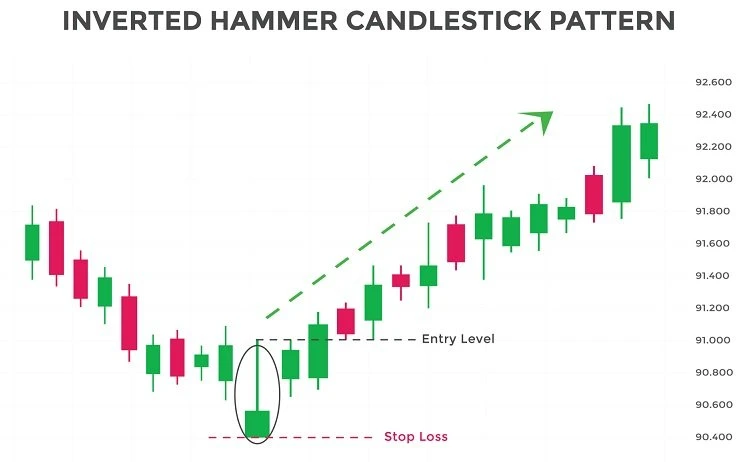
Hammer vs. Inverted Hammer
It’s important to distinguish the Hammer Candle Pattern from its counterpart, the Inverted Hammer. While both suggest potential reversals, they appear in different contexts:
- Hammer: Bullish reversal at the bottom of a downtrend.
- Inverted Hammer: Bullish reversal, but the candle’s long shadow points upward, often requiring additional confirmation.
Example: Hammer Candle Pattern in Forex
Let’s consider an example with the USD/JPY pair:
- Scenario: After a prolonged downtrend, the USD/JPY chart shows a Hammer Candle forming near the 130.00 support level.
- Confirmation: The next candle closes above the Hammer’s high, supported by an oversold RSI reading.
- Trade Setup:
- Entry: Long position at 130.50.
- Stop-Loss: Below the Hammer’s low at 129.80.
- Take-Profit: Resistance at 131.50.
This trade offers a favorable risk-to-reward ratio, leveraging the Hammer Candle’s reversal signal.
Strengthening the Signal: Combining with Other Tools
To maximize the Hammer Candle Pattern’s effectiveness:
- Use Support Levels: Hammers forming near strong support zones are more reliable.
- Combine with Volume: Increased trading volume during the Hammer Candle strengthens the pattern’s validity.
- Employ Moving Averages: Patterns forming near key moving averages (e.g., 50- or 200-day MA) often indicate stronger reversals.
Common Mistakes to Avoid
- Ignoring Confirmation: Entering trades before the next candle confirms the reversal can lead to losses.
- Trading in Sideways Markets: The Hammer is less reliable in choppy, range-bound markets.
- Overlooking Risk Management: Failing to set stop-loss and take-profit levels can expose traders to unnecessary risk.
Conclusion
The Hammer Candle Pattern is a powerful tool for forex traders, providing a clear visual signal of a potential bullish reversal. When combined with technical analysis, confirmation tools, and prudent risk management, it can significantly improve trading outcomes.
As with any trading strategy, practice and backtesting are essential to mastering the Hammer Candle Pattern. By incorporating it into a well-rounded trading plan, you can enhance your ability to navigate the forex market with confidence.


